
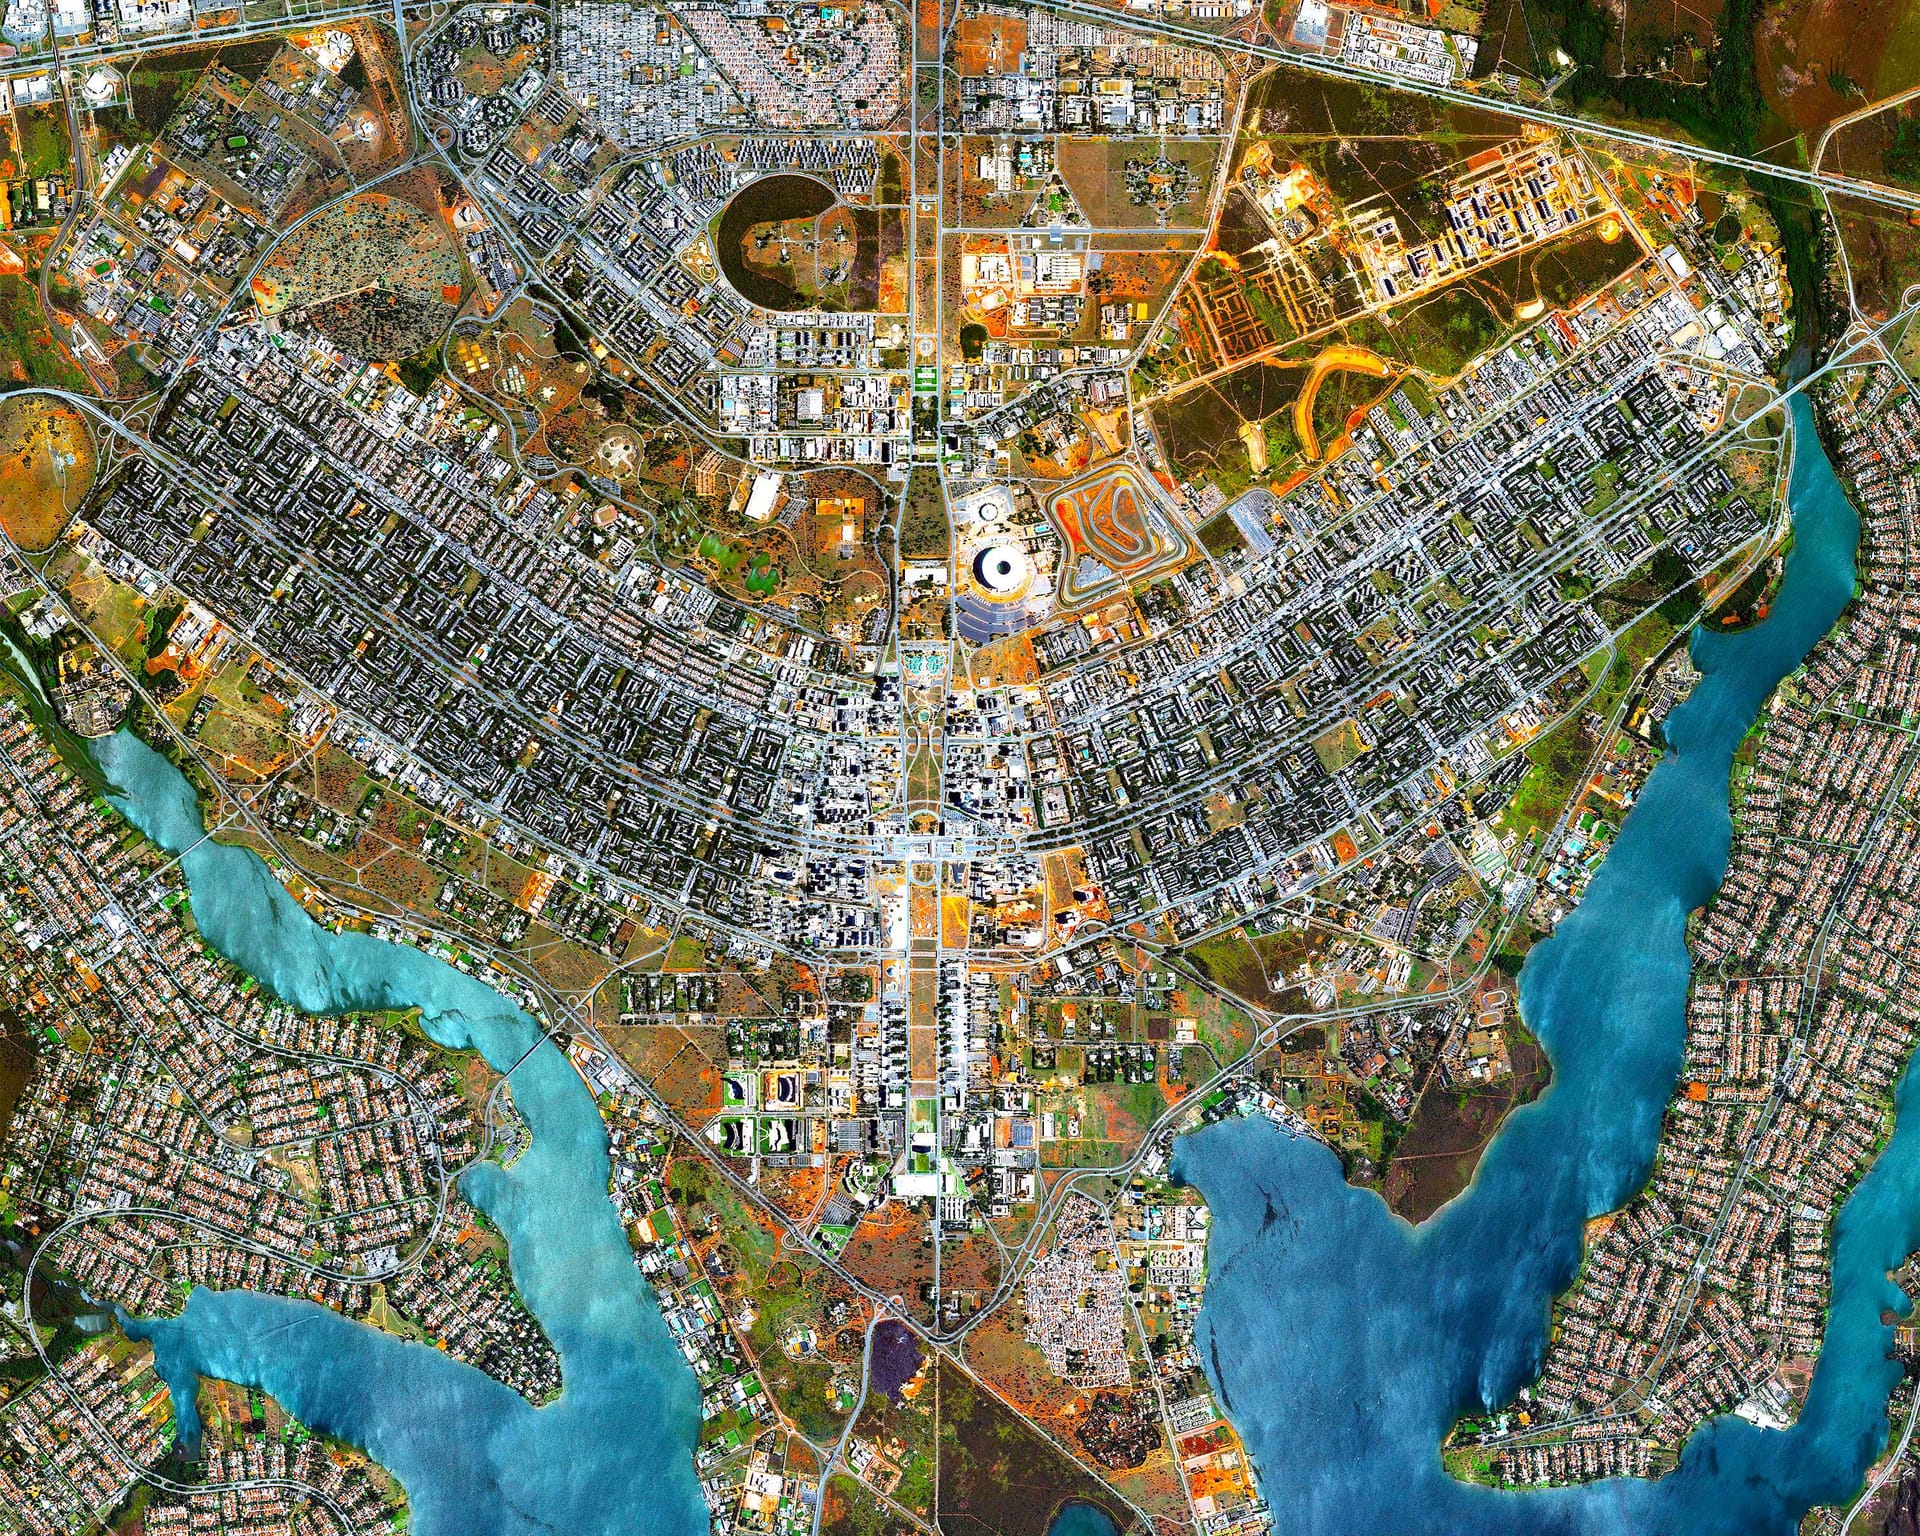
I've lived in Brasília most of my life. It is typical for people here to be quick to attribute things to corruption. We are culturally inclined to expect errors due to malice instead of incompetence. Sometimes it sounds a little paranoid, but it is certainly not uncalled for. As I analysed these records of federally funded infrastructure projects in Brazil’s Federal District, I found myself searching for a scoop. What secrets did nobody bother to hide? What is conspicuously missing?
This article shows a rudimentary method to find unusual items in a dataset, how much you can get out of little data from several angles (geographic, dates, money, text), and how interactive embedding plots make exploratory text-as-data work actually usable.
Data is from Obrasgov; I did this as a task for LabLivre on 15 October 2025. The dataset contains 690 distinct project IDs and R$7.92 billion in planned investment. The tooling was ordinary Python: pandas, matplotlib, seaborn, altair, pingouin, statsmodels, umap, hdbscan. This was done before Claude Code, using Cursor mostly for formatting the plots.
Data cleaning
We start with the typical preprocessing steps. These are the data quality issues:
- Duplicates: 87 duplicate records.
- Missing values: important fields were 95% empty -- notably, the actual dates. This pattern suggests that most projects are still in planning and thus do not have actual dates.
- Placeholder values: postal codes entered as “1” or blank spaces.
- Nested data: The JSON response contains nested data that need to be normalised before they can be stored in relational tables.
- pt-BR text encoding: 18 records have mojibake -- that is,
execuçãoshows up asexecução. This is common when working with pt-BR. While UTF-8 is the standard today, you often find Latin-1/cp1252 in the wild, especially with legacy systems. - Testing in prod: 22 apparently fictitious records. While poking around, I stumbled upon a name
teste. Once I realised they were testing in the production database and forgetting to delete the rows, I got more concerned and poked around some more, which is how I foundronaldon further test rows. This record makes the placeholder pattern visible immediately:
{
  "idUnico": "4541.53-44",
  "nome": "202111-22-Ronald 1",
  "descricao": "2021122-Ronald - Descrição do Projeto",
  "endereco": "2021122-Ronald - Endereço Completo",
  "dataInicialPrevista": "2021-12-10",
  "dataFinalPrevista": "2021-12-10"
}
Eight distinct project IDs share that name. Hopefully this is not a real name.
After cleanup, we are now at 690 records. After this, I did some feature engineering:
- Text: combined the text data for natural language processing (NLP).
- Money: bands by order of magnitude, plus a bool for projects costing less than 1 BRL.
- Geographic: latitude and longitude, derived by geocoding the address and postal-code fields.
- Dates: planned and actual dates, plus a calculated duration field.
The remaining fields describe each undertaking’s reported status, its nature (such as a study, engineering design or construction works), the type of intervention (such as new construction, renovation or equipment), and whether it is recorded as using Building Information Modelling (BIM).
Analysis
Profile and dates
- Project classification: most entries (73%) are classified as "construction" works rather than "projects" or "infrastructure investment" projects. I don't know the domain, so I'm unsure what this means.
- Type of work: 44% involve new construction, while 54% involve renovation, expansion or rehabilitation.
- Suspicious values: organisations associated with multiple codes, and multimillion-real projects with a planned duration of zero days.
- BIM: only 3.5% of projects used BIM.
Here we have a first finding. Remember how the missing data suggests that most projects are in planning phase? Well, at the time of access, most final dates had already passed. On 15 October 2025, 8% were recorded as completed, 12% as under execution and 72.3% of projects were scheduled to finish before then.
For example, project 3836.53-40, costing R$90M, was scheduled to run from 20 Sept 2021 to 20 March 2025, yet its status is still "Cadastrada" (registered) and both actual dates are empty. It is one of 364 projects in that situation.
Investment, duration and null values
Some 17.2% of projects are recorded with less than R$1 in planned investment. Considering only the other ones, the distribution appears approximately log-normal, a common pattern in non-negative quantities such as money.
This has a few consequences:
- Large investments are much rarer than smaller ones.
- High values are not necessarily outliers: they are an expected feature of this kind of distribution.
- The mean (R$13.9 million) tells us little about a typical project, as it is heavily influenced by the largest amounts.
Some records look suspicious: multimillion-real projects with a planned duration of zero days. Again, with no domain knowledge it's hard to know what this means. Maybe it's blatant corruption; maybe it's normal practice. A year ago I was more inclined to think something was up; with more experience I understand that systems need to be a little flexible.
| Project ID | Description | Planned duration | Planned amount |
|---|---|---|---|
| 2744.53-14 | Obra no Batalhão Escola e Pronto Emprego para implantação do… | 0 | R$24M |
| 53527.53-19 | CONSTRUÇÃO DE UNIDADE DE ATENÇÃO ESPECIALIZADA EM SAÚDE | 0 | R$2.4M |
| 53528.53-75 | CONSTRUÇÃO DE UNIDADE DE ATENÇÃO ESPECIALIZADA EM SAÚDE | 0 | R$2.1M |
| 46889.53-87 | CONSTRUÇÃO DE UNIDADE BÁSICA DE SAÚDE | 0 | R$1.3M |
We can see this in the CEP values as well. Before, I thought it was due to lack of care that the developers didn't validate CEPs and let invalid values through; now I assume there might be a reason to leave the field null. But if that is the case, it would be best to represent these as null.
In fact, after much thought, I am inclined to speculate that a lot of the data in here are actually placeholder values -- 1 as CEP, cost of 0 BRL, duration of 0 days. While I empathize with the need to have a data representation that handles real-world constraints, using these kinds of placeholders pollutes the data with several representations of the same concept (it conflates "missing data" with "zero"), which is hard to detect and reverse.
Unusual values
As I said above, I wanted to look into values which looked suspicious. There may be more established ways of doing this (see "anomaly detection"); I just came up with this method on the spot. I fitted a regression between planned duration and investment, then inspected the projects with the largest residuals. Sorting these by their absolute value gives the biggest outliers on both dimensions at once:
- A project with R$2.5 million in investment has a planned duration of just one day.
- An engineering project has a planned duration of three years but a budget of only R$5,000.
- SISFRON has the largest planned investment in the sample, R$840 million, but a planned duration of just 1.6 years – considerably shorter than other large projects, some of which are scheduled to last ten years.
| Project ID | Description (abridged) | Planned days | Planned amount |
|---|---|---|---|
| 46882.53-02 | Specialised healthcare unit | 1 | R$2,493,000.00 |
| 43724.53-06 | Engineering / architecture studies for a police facility | 1081 | R$4,684.45 |
| 557.53-69 | SISFRON border-monitoring system | 579 | R$839,664,954.32 |
| 10613.53-07 | Access to technical-standards collection | 1799 | R$47,700.00 |
| 5223.53-75 | Fire-prevention and complementary design services | 789 | R$20,305.41 |
| 39020.52-43 | BR-080/DF capacity and safety works | 629 | R$352,994,609.29 |
| 28451.53-40 | BR-080/DF road-section improvements | 755 | R$359,130,057.13 |
Among projects with investment amounts over 1 BRL (n = 569), planned duration and total investment show a moderate-to-strong Spearman1 correlation of ρ = 0.660. (95% CI [0.60, 0.69], p < 0.001). This is unsurprising as larger projects tend to take longer.
I don't understand the domain enough, so I'm not comfortable making any grand claims. Especially after reading the original domain-driven design book, I am convinced of the value of pairing computer touchers with domain experts -- though coding agents are transforming the economics of this. Just by knowing the magic words ("regression-based anomaly detection"; "what is BIM") these roles are now closer than they once were.
Aside: on rigour and flexibility
When studying the basics of science, you are warned to avoid certain sins, such as p-hacking. Running many tests looking for something is considered taboo. However, I find this is limited to the kind of science that is taught in an introductory class. They tell you about Popper, then about Kuhn, then tell you to go back to a (fantasized, positivistic version of) Popper, so you can finally get to work. Perhaps undergrads are not to be trusted with Feyerabend.2
Scientist initiates are taught an idealized version of science: controlled experiments which measure simple, predefined concepts and that produce nice numbers which can be used to make predictions. Strictly speaking, this is not an attempt to discover, but to measure something that is already well understood. One can only preregister an experiment if one knows what the experiment consists of.
Maybe this is true for established sciences that I know nothing about (geology? biology? physics?). But this is not the thick of the work in social science. This is especially the case with less established fields such as computational social science and digital humanities, which are more straightforwardly interested in this first moment of discovery, rather than in the second, most prestigious moment of measurement.
The book that opened my mind regarding this was Text as Data. Unlike more numeric data science, a lot of the text-as-data paradigm is exploratory and iterative.3 In the context of exploration, what might be considered p-hacking is just normal practice. However, TAD is not a flippant book (unlike, say, Feyerabend's). They rigorously define the two moments I outlined above: one where you decide the concepts and another where you measure. There must be a separation, otherwise you are p-hacking. I find this to be a nice compromise between rigour and flexibility. Discover twice, measure once, so to speak.
When I started this, I was still under the influence of that taboo. The result is that I engaged in much less exploration and trial-and-error than I should have. However, the affordances of this kind of discovery-shaped work still led me to use linear regression (usually a tool for prediction) for exploration, by reading its 'internal state' rather than its predictive output.4
Geographic data (GIS)
To get these I used two official APIs – IPEDF Geocode and ViaCEP, the latter geocoded through Nominatim. For the 690 projects, only 215 (31%) had usable postal codes, and of those only 129 were covered by the APIs. Sometimes different coordinates for the same code (e.g. 71205-050). Where both returned coordinates, I used IPEDF.
Given this is noisy, incomplete, low volume of data, it is not surprising that this map does not show much. Projects are concentrated around zones which are either the richest (Asa Sul) or the most populous (Ceilândia). Other areas, such as São Sebastião, barely appear.
The map has selection bias at two stages: first, a record must contain a postal code; second, that code must resolve to coordinates through the available geocoders. One would expect this to be confounded with socioeconomic status, as this is probably not missing at random.
Natural language processing (NLP)
Images are powerful. Coming from psychoanalysis and philosophy, I spent most of my time inside books with no pictures, so I always found them to be superfluous. I found it surprising just how much of data oriented fields depend on them. But after my education at LIS I am now coming around to their value. They convey a lot of information in a compact way (Tufte), sure, but most importantly, they are easy to pay attention to. People just connect to images more. 5 In a world defined by information overload, making things "easy to pay attention to" and more "salient" is a primary concern.
Words don't generally play well with images -- consider the ever ugly and useless word cloud. NLP must envy areas such as network analysis and complexity science, which are naturally inclined towards fancy visualizations.
In NLP, the striking imagery comes mostly from embeddings. Normal 2D embedding plots (e.g. matplotlib in Jupyter) look fine but are rarely useful. Interactive 2D/3D embedding plots are more impressive (Plotly in marimo), but still leave something to be desired. What I found actually useful for data exploration was combining them with search.
In practice, this is rather simple: embeddings, dimensionality reduction and clustering. You need a GPU, but Google Colab has a generous free tier. The plots in this article are "handmade" (with Claude/Codex) and took me a while to get right. Fortunately for you, you can just paste the URL to your agent and copy the style. I've done my share of this "borrowing" from seonglae/CorrSteer and albedo.sh.
To see the power of search, try escola (107 descriptions), creche (68) or quadra (46) and watch where the matches land. It's an easy way to find clusters. If the point of the exploratory step is to find patterns that might turn into something, this seems more convenient than messing around with topic modelling and clustering.
My attempt at clustering is below. The clusters don't come with labels; these are the ones I came up with:
The registered projects total R$8.4 billion in planned investment. The figure above suggests that funding is heavily concentrated in procurement (50%) and civil engineering (25%). Less than 1% goes to social services, healthcare, basic education and energy initiatives.
Despite having similar numbers of projects, higher education received eight times as much funding as basic education. The concentration of funding in procurement warrants further investigation. Reallocating just 0.6% of the amount assigned to procurement would be enough to double healthcare investment.
However, this depends on the categories being correct, and we have good reason to think they are misleading. Procurement, the largest category, appears to combine several otherwise distinct categories, including military and hospital projects. This is a failure of the automatic clustering; I messed around with hyperparameters but I didn't get anywhere.
The procurement group includes police, armed forces, school and hospital projects, grouped together -- perhaps because their descriptions use similar wording rather than because they address the same subject. Health or education projects could be hidden inside it, so a more refined grouping could make much of the dramatic concentration up there disappear.
Manual spot checking revealed unrelated projects registered with a very similar template, which the model can use as a shortcut. For example, five otherwise unrelated records all open with the same procurement boilerplate: "O objeto da presente licitação é a escolha da proposta mais vantajosa para a contratação de..."
Conclusion
This report analyses 712 infrastructure projects receiving public investment in Brazil’s Federal District, with a combined planned investment of R$8.4 billion. Findings include:
- 72% of planned completion dates are already in the past
- 17% have investment amounts below R$1
- Around half are renovation/expansion and another half are new construction.
- Investments have a minimum of 5k, maximum of 840M, and half of them are between 0.6M and 8.4M.
- Planned durations have a minimum of 0 days, maximum of 13 years, and half of them are between 0.8 and 3 years.
- Less than 1% goes to healthcare, basic education and energy compared to the 50% of funding allocated to procurement projects and 25% to civil engineering.
- Higher education receives eight times as much funding as basic education.
- Unusual records include a R$2.5 million project scheduled to last one day
Beyond missing dates and geographic data, I suspect that data quality is compromised by the use of placeholder values instead of null values. While we can manually inspect unusual records, identifying problems reliably would require a system in which the data representation itself is less flexible. It is hard to draw confident conclusions when so many data points are anomalous in some way. Regardless, creating a rotating 3D plot is not contingent on data quality, and probably increases the perceived value of the analysis.